Dashboards
In the payments industry, data is the key driver for making informed decisions, adapting quickly to changes, and implementing strategies that respond effectively to different events. To help you access, understand, and act on your data, we provide a built-in Dashboards tool.
With Dashboards, you can leverage a set of default charts for immediate insights or create fully customized views tailored to your business needs.
Dashboard Capabilities
When you log into your merchant account, you’ll find a default dashboard already set up with essential charts and KPIs. From there, you have complete flexibility to:
- Personalize the default dashboard – adjust the charts and KPIs that are most relevant to you.
- Create your own dashboards – organize separate dashboards by focus areas, such as fraud, revenue, or partner performance.
Default Dashboard
The default dashboard is available as soon as your account is created. It provides a comprehensive overview of your payments performance through a set of key charts and metrics, including:
-
Trends – authorized orders vs. authorized turnover over a selected timeframe.
-
KPI metrics (tiles):
Authorized turnover and number of orders
Success rate (%)
Captured turnover and number of orders
Average basket value (in your settlement currency)
Refunds (total value and count of refund orders)
Chargebacks (total value and count of chargeback orders)
Global performance – performance rates per PSP.
Fraud results – transactions broken down by fraud status.
Performance analysis – performance by payment method.
Partner distribution timeline – payment method distribution by partner over time.
Sales channel distribution – recurring vs. non-recurring payment share.
Refunds by reason – categorized view of refund causes.
Chargebacks by reason – categorized view of chargeback causes.
Country distribution – payment volumes per country, including payment method usage per region.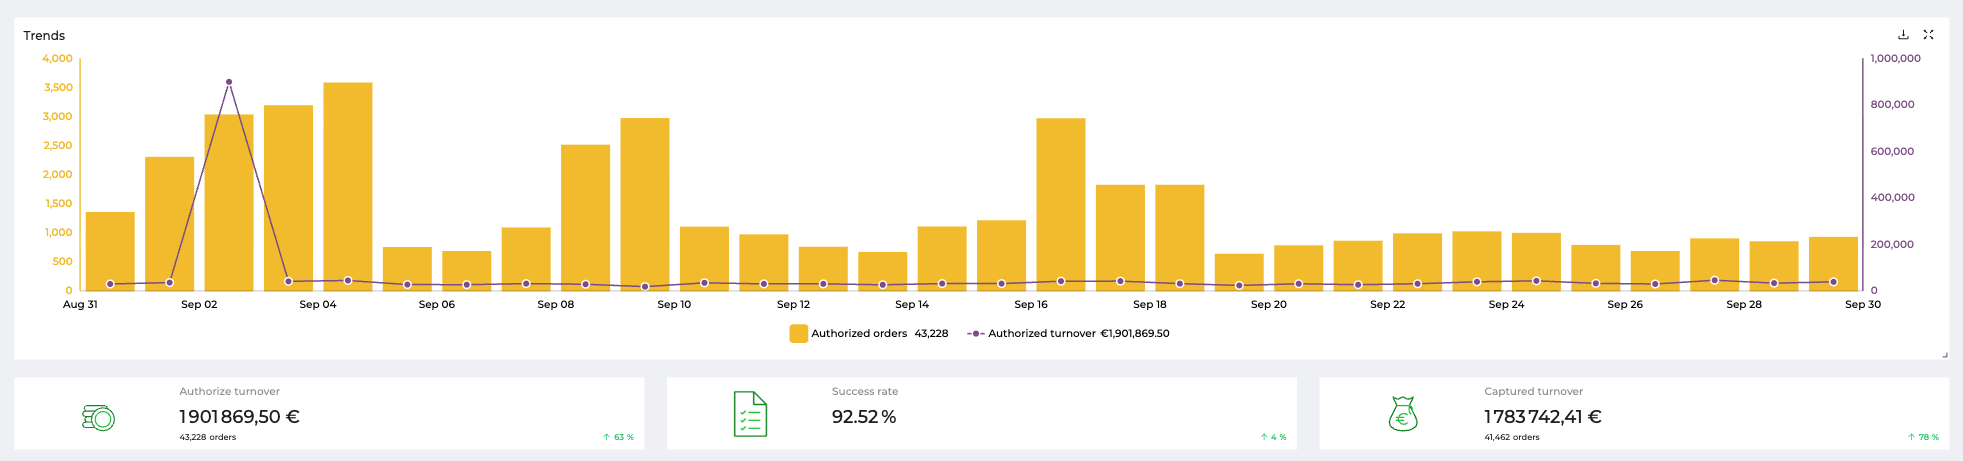
Dashboards: widgets example
Getting Started with Your Dashboard
Personalize an Existing Dashboard
- Access Dashboards
-
Log in to your merchant account.
-
Navigate to Brainpower → Dashboards.
-
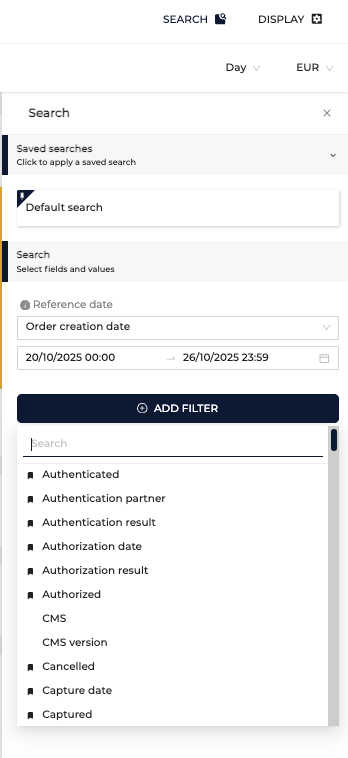
Apply filters to refine your view by timeframe, data points, or other criteria.
-
- Adjust an Existing Dashboard
-
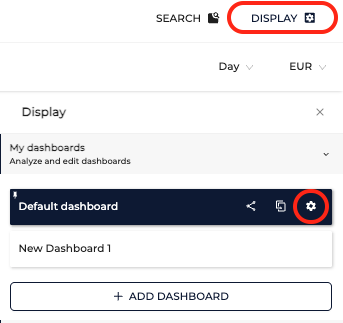
Go to the Dashboard you want to adjust by clicking on the settings wheel,
-
Two sections will appear:
Dashboard Widgets – already added to your dashboard, configured and named
Add a chart – widgets you can add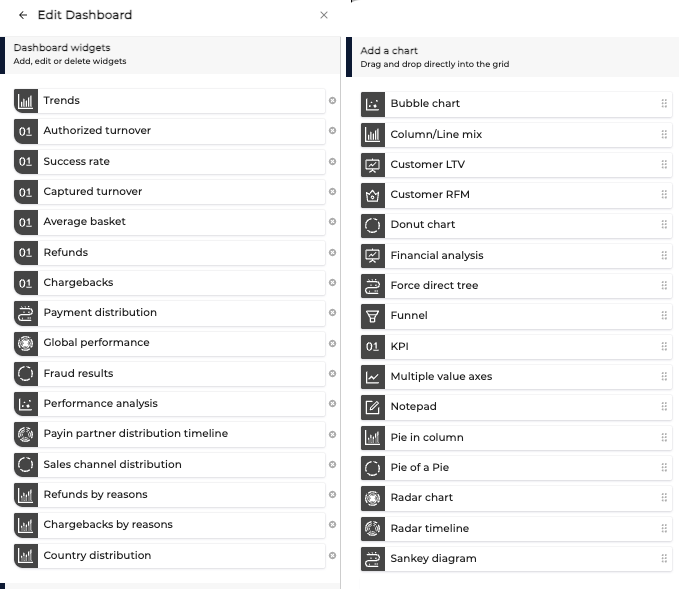
-
To add a widget, drag and drop it into your dashboard.
- Edit Widget Details
-
Click on any widget to access its settings, including:
Widget Type (eg. Radar Chart)
Dimensions (e.g., Payin Partner)
Indicators (metrics being displayed, eg. Trx Success Rate, Trx Authentication rate etc.)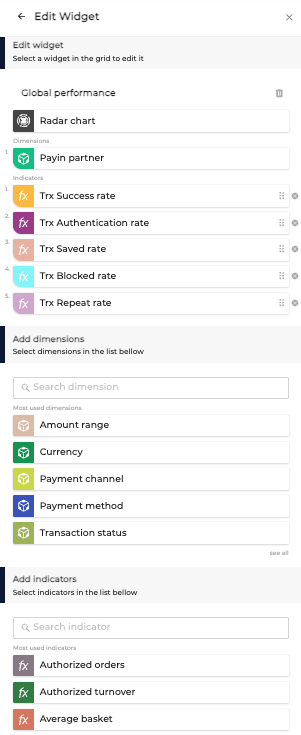
-
Additional dimensions and indicators are available — click See All to view the full list.
-
Create a New Dashboard
- Access Dashboards
- Log in to your merchant account.
- Navigate to Brainpower → Dashboards.
- Add a Dashboard
-
Click Display (top right) → Add Dashboard.
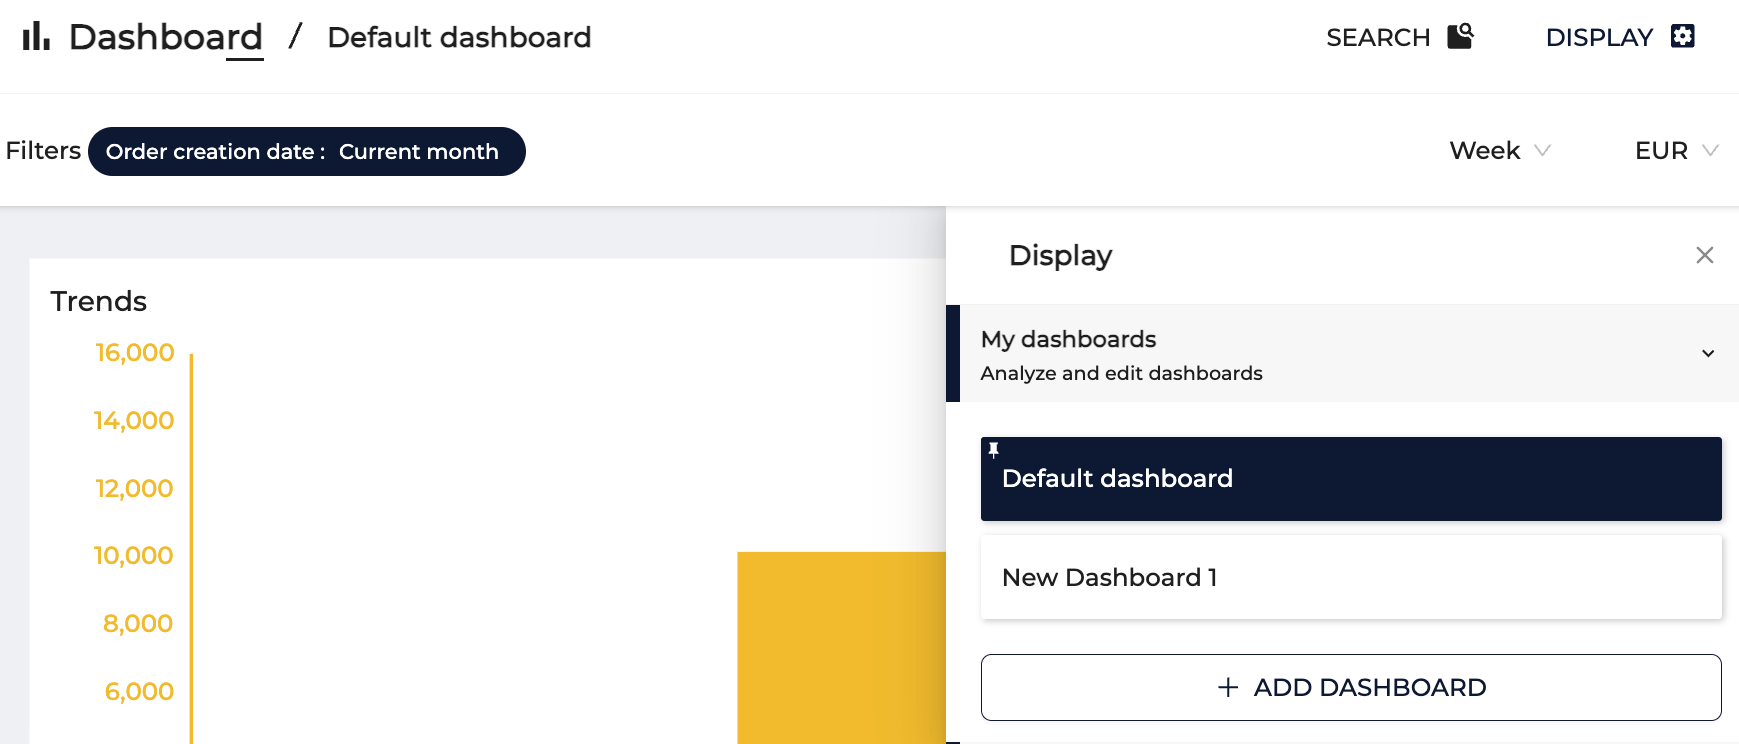
-
A blank dashboard will appear. Rename it to match its purpose.
-
To edit, select your dashboard, then click the gear icon.
-
Drag and drop available charts into the dashboard.
-
Configure each chart by selecting its dimensions and indicators.
-
Optionally, set it as your default dashboard.
-
By customizing dashboards, you transform raw payment data into clear, actionable insights — enabling faster decisions, stronger performance monitoring, and a deeper understanding of your business.
Updated 8 months ago